
Oracle Cloud Infrastructure (OCI) Monitoring is a vital part of managing and optimizing your cloud resources. However, the terminology used in OCI Monitoring can be daunting for newcomers. In this blog post, we aim to simplify the terms and concepts to help you better understand and utilize OCI Monitoring.
OCI Monitoring service uses metrics to monitor resources and alarms to notify you.
Metrics
A metric is a measurement related to the health, capacity, or performance of a given resource.
A metric can tell you information like Availability and latency, uptime and downtime, and failed and successful operations for that resource.
A metric can be default or custom.
Metric Namespace
A metric namespace is a collection of similar metrics. OCI has various services, such as FSS, LBaaS, and Compute, each with its own set of metrics. For example, metric namespaces include OCI_FILESTORAGE, OCI_LBAAS, and OCI_COMPUTEAGENT. Essentially, the metric namespace indicates the resource, service, or application emitting the metric.
Dimension
A dimension, although a potentially confusing term, essentially means “filter.” For example, if you want to see the cost of your OCI resources by region, you would use a dimension name-value pair for filtering, such as region = “Ashburn” or region = “Phoenix.”
Metadata
Metadata is a reference provided in a metric definition, such as the unit (bytes) for measuring DiskBytesRead. Metadata helps determine additional information about a given metric.
Data Point
A data point is a timestamp-value pair. For example, “At 2022-05-10 01:00 US ET, your CPU utilization was 90%” or “At 2022-05-12 09:00 US ET, your HTTP Failure rate was 7%.”
Metric Definition
Example: oci_computeagent is Metric Namespace
Inside it is a metric named DiskBytesRead
DiskBytesRead needs to be defined by a “Metric Definition” and that “Metric Definition” will have information like dimensions (such as resource identifier) and metadata (specifying bytes for the unit) as well as identification of its metric namespace (oci_computeagent).
Data points carry this information.
Resources
Resources are the OCI objects you create and use, like compute machines, load balancers, etc.
Alarms
Alarms are raised when metrics meet specified triggers. Alarms use ‘Alarm Query,’ as described later in this article.
For example:
You have a compute machine (‘Resource’).
Your machine is sending you some monitoring data like CPU usage, disk read data (‘Metrics’)
You want to automatically spin off a new machine when your CPU load goes above 90% (‘Alarm’)
You also want to get an email notification alert when such Alarm is raised (‘Topic’ and your emails is ‘Subscription’)
Alarm Query
An Alarm Query is written in Monitoring Query Language (MQL) to evaluate for the alarm. It must specify a metric, statistic, interval, and a trigger rule (threshold or absence). For example, “CpuUtilization[5m].max()” specifies a 5-minute interval.
Frequency
Frequency is the time period between each posted raw data point for a given metric. Default service metrics typically have a frequency of 60 seconds.
Interval
The interval is the time window for your analysis. For example, a five-minute interval from 2:00:00 to 2:05:00 corresponds to the timestamp “2:05.”
Suppression
Suppression is a configuration to stop publishing messages during a specified time range. It is useful for suspending alarm notifications during system maintenance, similar to a blackout in OEM applications.
Time Range
The time range refers to the bounds (timestamps) of the metric data you want, such as the past hour.
Trigger Rule
The trigger rule is the condition that must be met for the alarm to be in the firing state. It can be based on a threshold or absence of a metric.
Aggregate metric streams
Aggregate metric streams ((grouping()) returns the combined value of all metric streams for the selected statistic. The Aggregate metric streams option is equivalent to grouping() in the MQL expression. Aggregate all metric streams to return the combined value of all metric streams for the selected statistic. For example, aggregate all metric streams for CPU Utilization to return the combined value across all resources.
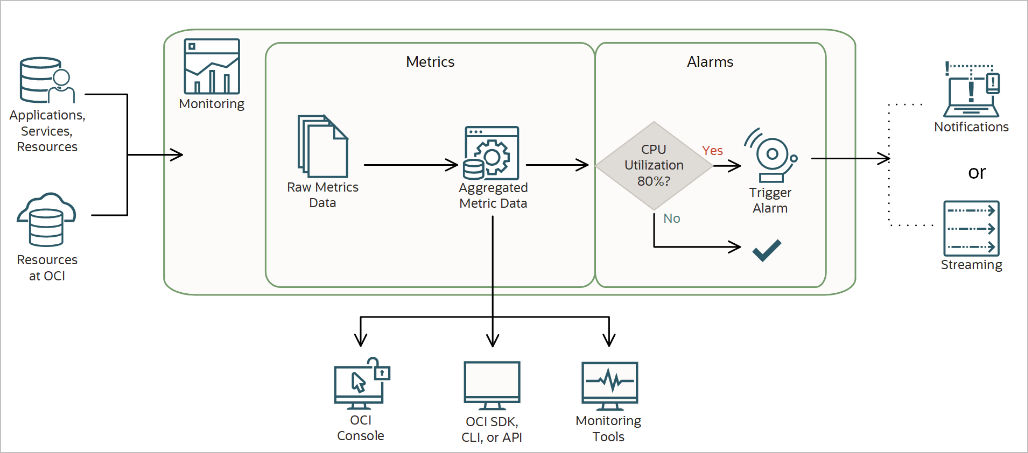
Understanding the terminology used in OCI Monitoring is crucial for effectively managing your cloud resources.
The below diagram taken from Oracle Documentation is a good representation:
This is one of the posts in the Oracle Cloud Infrastructure (OCI) Monitoring Series. Click on the below links to read more posts from the series:
- From Chat to Autonomous Agents: A Maturity Model for DBA AIOps - April 27, 2026
- Query Catalog Pattern for Natural Language to SQL: Frontmatter-Driven Routing - March 22, 2026
- Safe Ansible Automation for AI Chat: A Guardrail Framework - February 3, 2026