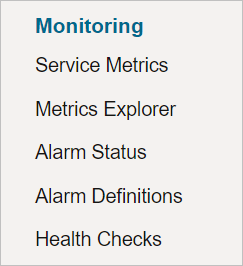
Monitoring your Oracle Cloud Infrastructure (OCI) is essential for maintaining the performance, availability, and security of your cloud-based applications and services. This post will explore the five key aspects of OCI Monitoring – Service Metrics, Metrics Explorer, Alarm Status, Alarm Definitions, and Health Checks. We will cover theoretical aspects only in this post. In later posts, we will do hands-on exercises to understand how Monitoring works in Oracle Cloud Infrastructure (OCI)
By understanding and mastering these components, you can efficiently monitor your OCI environment and ensure optimal performance.
1. Service Metrics:
Service Metrics are quantitative measurements of the performance, capacity, and availability of your OCI resources. These metrics enable you to monitor the health of your infrastructure, identify potential issues, and optimize resource usage. Some common service metrics include:
- CPU Utilization: The percentage of CPU capacity used by an instance.
- Memory Utilization: The amount of memory being used by an instance.
- Network Throughput: The amount of data transferred across the network.
OCI collects these metrics automatically, allowing you to visualize and analyze them in real time.
Metrics are clubbed into Metric Namespaces as shown below:

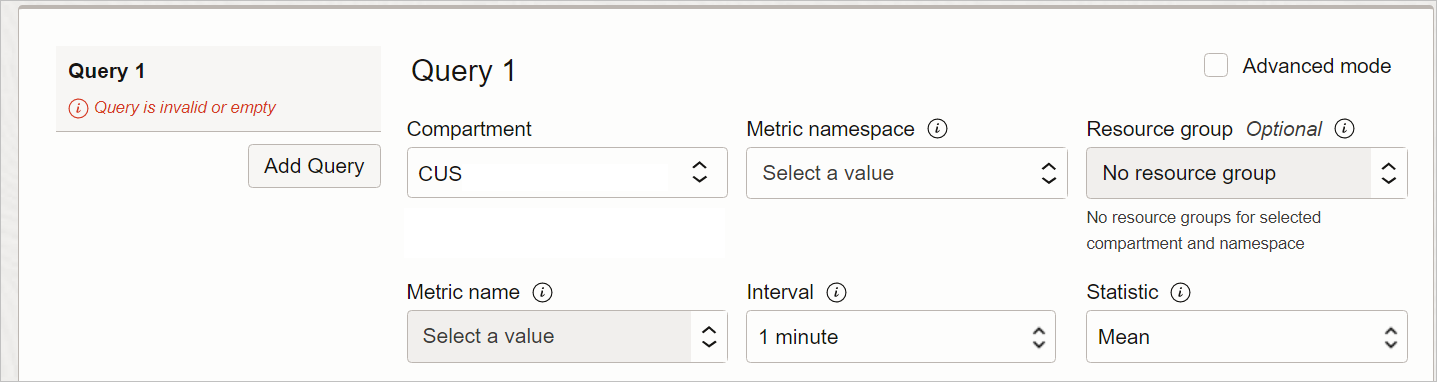
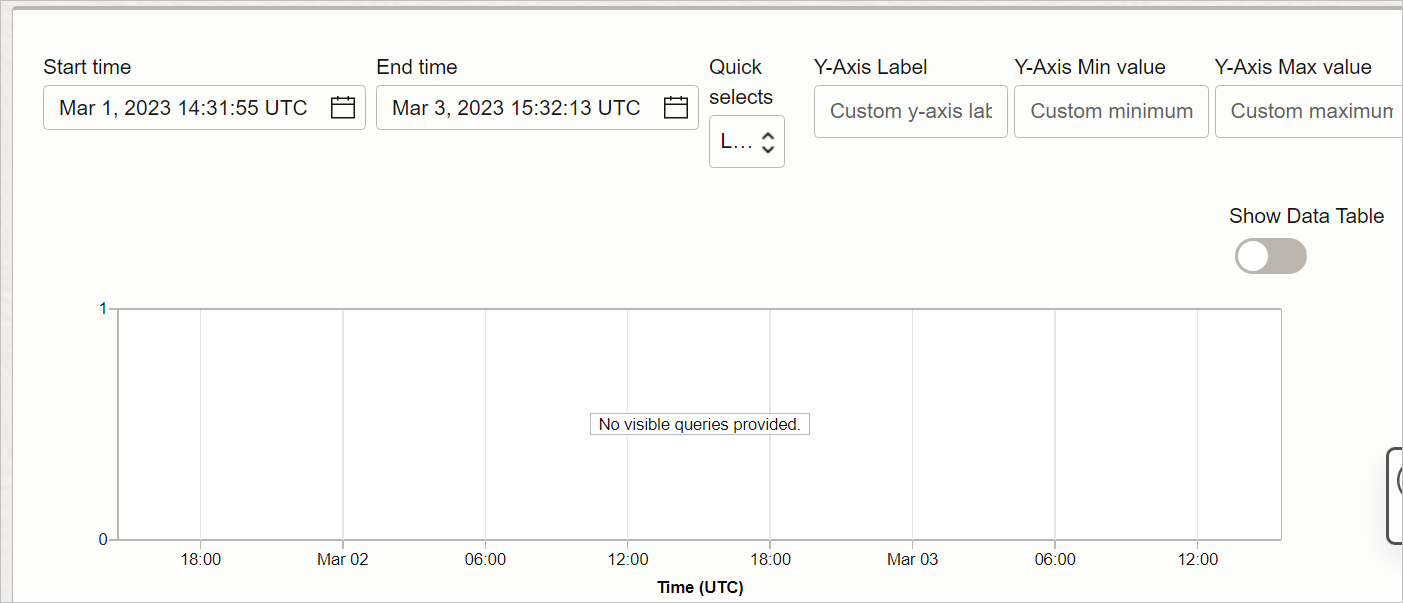
2. Metrics Explorer:
The Metrics Explorer is a powerful tool within OCI Monitoring that allows you to explore and analyze the metrics collected for your resources. You can filter, aggregate, and compare metrics, as well as create custom charts and dashboards. This helps you gain insights into your infrastructure’s performance, identify trends, and detect anomalies.
You define some queries by using some easy-to-use drop-downs and then you get a beautiful graphical format.
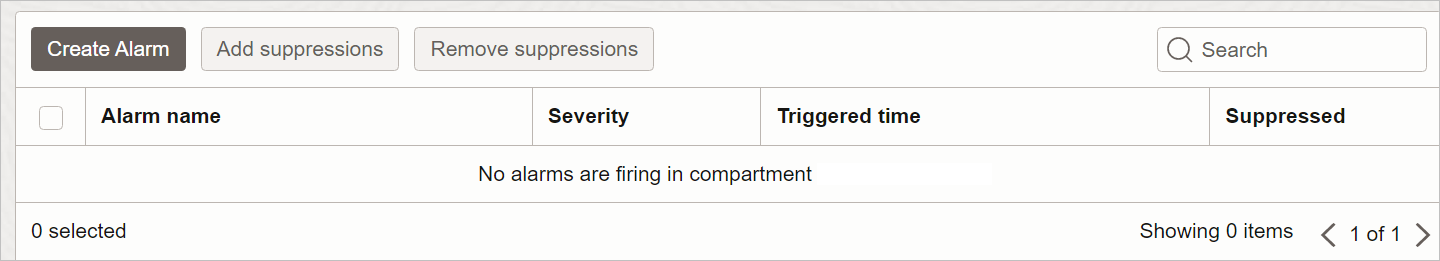
3. Alarm Status:
The Alarm Status aspect of OCI Monitoring helps you stay informed about the state of your resources. Alarms are triggered when specific metric thresholds are breached, indicating potential issues that require your attention. Alarm Status provides an overview of all your active alarms, their severity, and the resources they are associated with. This enables you to quickly identify and address any problems in your OCI environment.
4. Alarm Definitions:
Alarm Definitions are the rules you create to trigger alarms based on specific metric thresholds. You can define alarms for various performance indicators, such as CPU utilization or network throughput. When creating an alarm definition, you can specify the metric, the threshold, the evaluation period, and the actions to be taken when the alarm is triggered. This helps you proactively address issues and maintain optimal performance.
We will define some sample alarms in our upcoming posts to show how it works.
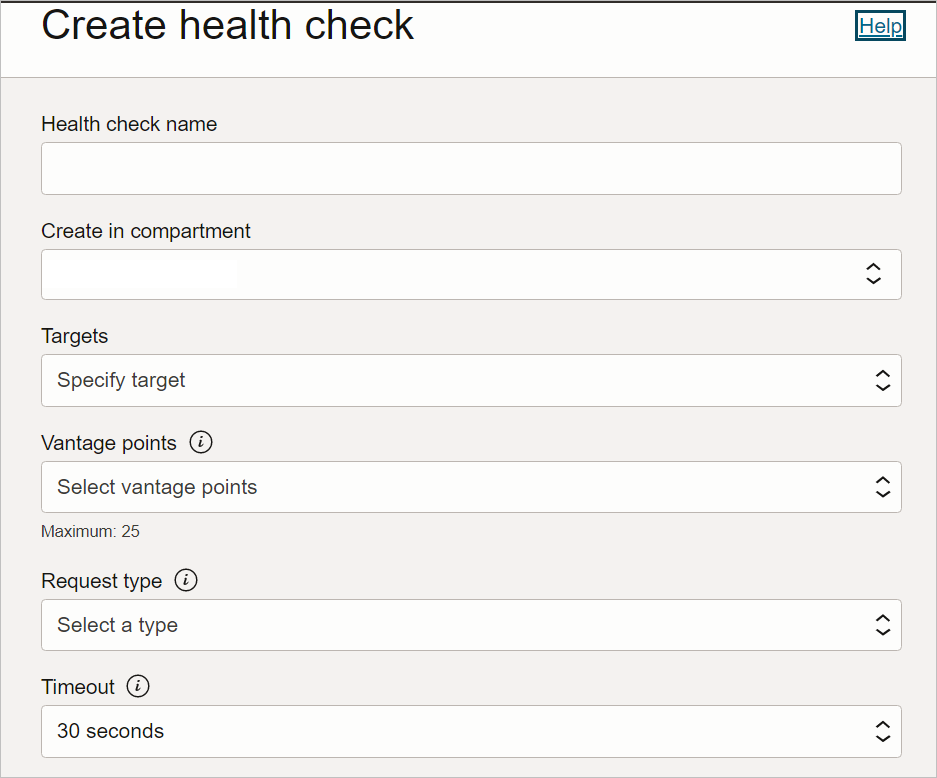
5. Health Checks:
Health Checks are an essential aspect of OCI Monitoring that allows you to monitor the availability and responsiveness of your services. By configuring health checks, you can periodically send requests to your resources, such as web servers or load balancers, and evaluate their responses. If a resource fails to respond within a specified time or returns an unexpected response, OCI Monitoring can trigger alarms or notifications. Health Checks help ensure your applications and services are always up and running, providing a reliable experience for your users.
This is one of the posts in the Oracle Cloud Infrastructure (OCI) Monitoring Series. Click on the below links to read more posts from the series:

- Oracle Database Service for Azure (ODSA) 3 – Database Services - May 1, 2023
- Oracle Database Service for Azure (ODSA) 2 – Interconnect Details - April 30, 2023
- Oracle Database Service for Azure (ODSA) 1 – Fundamentals - April 29, 2023