
Analyzing a tkprof file is the key part for a DBA to get to the root of performance issue. This post will describe many useful information regarding tkprof files which should definitely help you familiarize with the tkprof files.Session tracing and tkprof can be used to see exactly what is happening on the database or at session level which helps DBA/Developers to take corrective action.
This post is part 3 of the below posts on trace and tkprof. Please refer other posts to read related information.
Part 1: Trace and the methods to generate trace
Part 2: Generating TKPROF from trace file
Part 3: Analyzing TKPROF files
Part 4: Using Trace Analyzer (TRCANLZR) Tool
This post will cover Part 3: Analyzing a tkprof file
SECTIONS OF A TKPROF FILE
Each tkprof output file can be broadly divided into a header, body, and summary section.
HEADER: Displays the trace file name, definitions, and sort options selected.
BODY: Contains the performance metrics for SQL statements.
SUMMARY: Contains an aggregate of performance statistics for all SQL statements in the file.
Let us discuss each section one by one
HEADER SECTION
As shown in below example screenshot of tkprof header, every TKPROF report starts with a header that lists below information:
- TKPROF version
- Date and time the report was generated
- Name of the trace file
- sort option used
- brief definition of the column headings in the report.
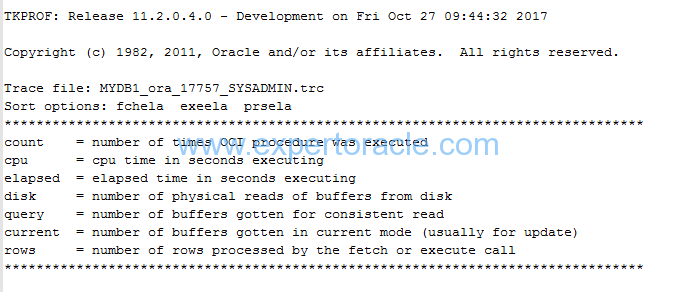
Much of the information in the header section is static information.
BODY SECTION
The main body of the TKPROF report consists of one entry for each distinct SQL statement that was executed while SQL trace was enabled.Let us look at one such portion of the tkprof from the body section to first define the basic terminology used in the TKPORF File. TKPROF will contains many such section for each SQL which was run in that session. The entries for each SQL statement in the TKPROF report are separated by a row of asterisks.
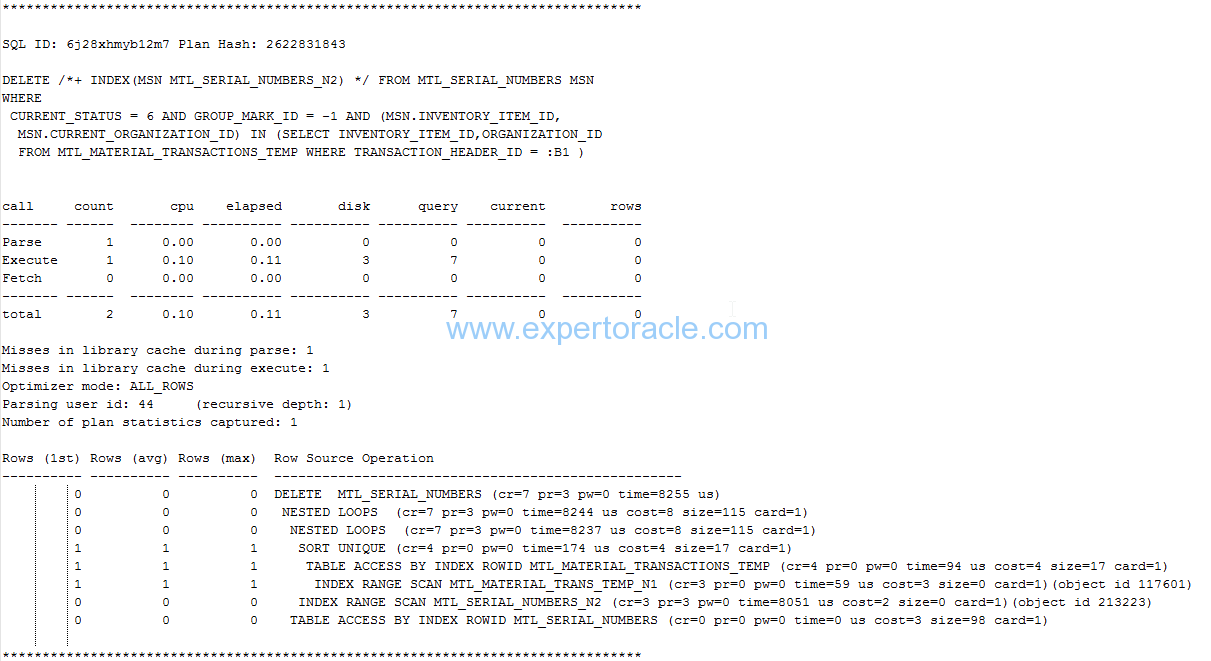
The output above displays a SQL statement first and then its table of performance metrics.
Overall the structure of the tkprof body output is:
- SQL Statement
- Parse/Execute/Fetch statistics and timings
- Library Cache information
- Row source plan
- Events waited for by the statement
Please note that this is tkprof doesn’t contains the wait event information as the trace that was applied was not level 8 (with waits) trace.
Here SQL_ID is 6j28xhmyb12m7 and plan hash value assigned to this SQL_ID is 2622831843. Now go through below table to understand what each term means in the above tkprof portion
| TERM | UNIT OF MEASURE | MEANING |
| Call | Not Applicable | Statistics for each cursor’s activity are divided in to 3 areas: Parse/Execute/Fetch. A total is also calculated. |
| Parse | Number of times | Statistics from parsing the cursor are shown. This step checks for proper security authorization and checks for the existence of tables, columns, and other referenced objects and translates the SQL statement into an execution plan.The parses might be HARD or SOFT |
| Execute | Number of times | statistics for the execution phase of a cursor. For INSERT, UPDATE, and DELETE statements, this modifies the data. For SELECT statements, this identifies the selected rows. |
| Fetch | Number of times | Statistics for actually fetching the rows. Fetches are only performed for SELECT statements. |
| count | Number of times | Number of times each individual activity like parsed, executed, or fetched has been performed on this particular cursor. You should investigate why the counts are high. Specially if you see high number of parses then it is very important to find the cause. |
| cpu | Seconds | The total CPU time in seconds for all parse, execute, or fetch calls. Remember that TIMED_STATISTICS database parameter must be enabled to populate this information or else it will show 0 here. |
| Elapsed | Seconds | Total elapsed time in seconds for all parse, execute, or fetch calls.It is the time taken to identify and modify rows during statement execution on the server. If this value is higher than CPU time, then you should review the wait events sections in the tkprof for the SQL to understand where the waits happened. |
| disk | Number of Data Blocks | Total number of data blocks physically read for all parse, execute, or fetch calls. Generally it would be preferable for blocks to be read from the buffer cache rather than disk. |
| query | Number of Data Blocks | This is Logical read. Total number of buffers retrieved in consistent mode for all parse, execute, or fetch calls. A Consistent mode buffer is one that has been generated to give a consistent read snapshot for a long running transaction. Consistent read means “get the block as it appeared at the beginning of our statement, using rollback data if needed to undo changes”. Usually, this type of logical read is used by queries. |
| current | Number of Data Blocks | This is Logical read. Total number of buffers retrieved in current mode. Current mode means “get the as it exists RIGHT NOW. No need of applying any rollback data etc”. Buffers are retrieved in current mode for statements such as INSERT, UPDATE, and DELETE. |
| rows | Number of rows | Total number of rows processed by the SQL statement. This total does not include rows processed by subqueries of the SQL statement. For SELECT statements, the number of rows returned appears for the fetch step For UPDATE, DELETE, and INSERT statements, the number of rows processed appears for the execute step. |
| total | number of times | Sum of all operations |
| Misses in library cache during parse | number of times | Indicates that the the statement was found (soft parse) or not found (hard parse) in the library cache. If it is 0 then it means soft parse happened as there was no miss. If it is 1 then it means one hard parse happenedIf there are a high number of parses per execution, this could indicate the lack of use of bind variables in SQL statements or poor cursor reuse. So our goal is that misses should be minimum or zero. |
| Misses in library cache during execute | number of times | It means that the SQL text found but cursor not valid for reuse. Either object invalidation through DDL or different objects referenced/privileges meaning a new child cursor must be spawned. Misses while about to execute the plan and found it missing/invalid in library cache. If no hard parse occurred during execute calls, that specific line is missing. |
| Optimizer mode | Not Applicable | First_rows mode is a cost-based optimizer mode that will return rows as soon as possible, even if the overall query runs longer or consumes more resources.Such setting is good when user wants to see the result quicker. This optimizer mode favors index scans over full table scans.
All_rows mode ensures that the overall query time is minimized, even if it takes longer to receive the first row. |
| Parsing user id | Not Applicable | Database user id which was used to do parsing. If you specified the “explain” option also when generating TKPROF then username will also be mentioned along with userid. |
| Recursive Depth | Number | Recursive depth is provided only for recursive SQL statements. SQL statements directly executed by an application have a depth of 0.
Recursive depth 1 here indicates that the UPDATE is a child of some other piece of code with depth n-1 (in this case 0). |
| Number of plan statistics captured | Number | It tells you how many executions Oracle recorded information about the plan. It uses these to populate the “Rows (1st) Rows (avg) Rows (max)” columns in the row source operation |
| Row source plan | Not Applicable | This section displays the access path used at execution time for each statement along with timing and actual row counts returned by each step in the plan. This can be very useful for a number of reasons.
Row source plans are generated from STAT lines in the raw trace. |
| Rows (1st) | Number of rows | While database version before 11.2.0.2 used to provide a single column (“Rows”) for reporting the number of rows returned by every row source operation, 11.2.0.2 provides three columns (“Rows (1st)”, “Rows (avg)” and “Rows (max)”). Number of rows returned on the first execution |
| Rows (avg) | Number of rows | Average number of rows returned for all execution |
| Rows (max) | Number of rows | Maximum number of rows returned for all executions |
| Row Source Operation | Not Applicable | “Row Source Operation” is the actual execution plan written in the trace file by the server process.
Under “Row Source Operation” Heading first thing you will see is the operation type, example “Index range Scan” ” Nested Loops” “Select..” etc. After that in the brackets you will find the IO statistics like: cr = number of blocks read with logical reads in consistent mode. These statistics can be useful in identifying steps that read or write a particularly large proportion of the overall data. |
| Events waited for by the statement | Not Applicable | Although this section is not displayed in the above sample trace as we didn’t include the waits option while generating the trace file. This section displays all wait events that a statement has waited for during the tracing. This section can be very useful when used in conjunction with the statistics and row source information for tracking down the causes of problems associated with long wait times. High numbers of waits or waits with a long total duration may be candidates for investigation dependent on the wait itself. |
Analysis of the above Example Trace:
Now that we have understood what each term means we can easily analyze the trace file and put down some points regarding it.
For Parse row:
- Hard parse was done once as we can see Count as 1 against “Parse”
- CPU and ELAPSED time were less that 0.1 seconds for Parse operation and that is why you find them mentioned as 0
- No physical disk I/Os or even buffer gets were required for parsing which means that all dictionary data required to parse the statement were already in the dictionary cache in the SGA
For Execute row:
- The query was executed once as as we can see Count as 1 against “Execute”
- CPU time was 010 seconds and Elapsed time was 0.11 seconds for the Execute operation
- Physical I/O operation of 3 Blocks was done and 7 blocks were read from buffer cache
For Fetch row:
- Since this is a delete operation and no select statement is there so all records in “Fetch” rows are showing as 0
Remaining portion of trace:
“Misses in library cache during parse” is 1 which shows that there was a miss in the library cache as the SQL statement was not already in the shared pool. Hard parse was done.
Row source operation listing looks very much like an execution plan. It is based on data collected from the SQL trace file
SUMMARY SECTION
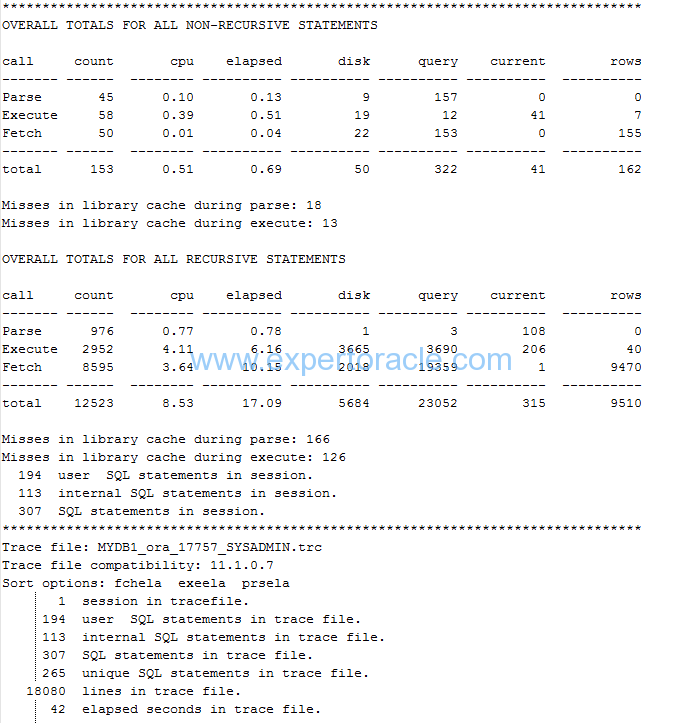
Analysis of Summary Section
- Note that non-recursive SQL statements are separated from recursive SQL statements.
- Compare Total Parse count (45) for non-recursive statement and “SQL statements in session.” (307) to spot over parsing. In this case we have 45 parses for 307 statements which can be OK as parse count is not very high.
- You can also find Library Cache hit ratio. As a general rule higher this hit ratio, better is the performance.
Physical reads for non-recursive SQLs = sum (disk) = 50
Logical reads for non-recursive SQLs = sum (query+current) = sum (322+41)=363
Hit ratio= 1 – (Physical Reads / Logical Reads)
Hit Ratio=1-(50/363)= 0.87 or 87%
- Total number of fetches is 50 and total number of rows returned is 155. We always want fetches to be less than the number of rows as this will mean Oracle has done less work to meet the need. 50 fetches for 155 records do not look very good number and we should see improvement scope by identifying SQLs in the tkprof for which more fetches are happening.
- Note the last line of the tkprof which says “elapsed seconds in trace file”. This is one key parameter that you should see when you you analyze a tkprof file to understand how long it took for the whole trace file operations. This data will tell you how big a problem you are going to deal with. In our case it is just 42 seconds which is a very small number.
KEY POINTS TO KEEP IN MIND WHILE ANALYZING TKPROF
- Identify SQL statements that do not use bind variables. These statements can possibly run faster by using bind variables instead of literal values.
- Identify statements that perform full table scans
- Identify statements that are doing multiple disk reads or have high CPU consumption.
- Compare the number of parses and executions. Ideal situation is when parsing is happening single time for multiple executions
- Look at the CPU and I/O statistics and see which statements consume the most system resources
- Row counts for individual SQL can also help in finding the inefficiencies. Check if tables are being joined in the wrong order
FEW MORE EXAMPLES OF TKPROF
EXAMPLE 1:
Below is on more example tkporf body portion showing one SELECT statement and its analysis
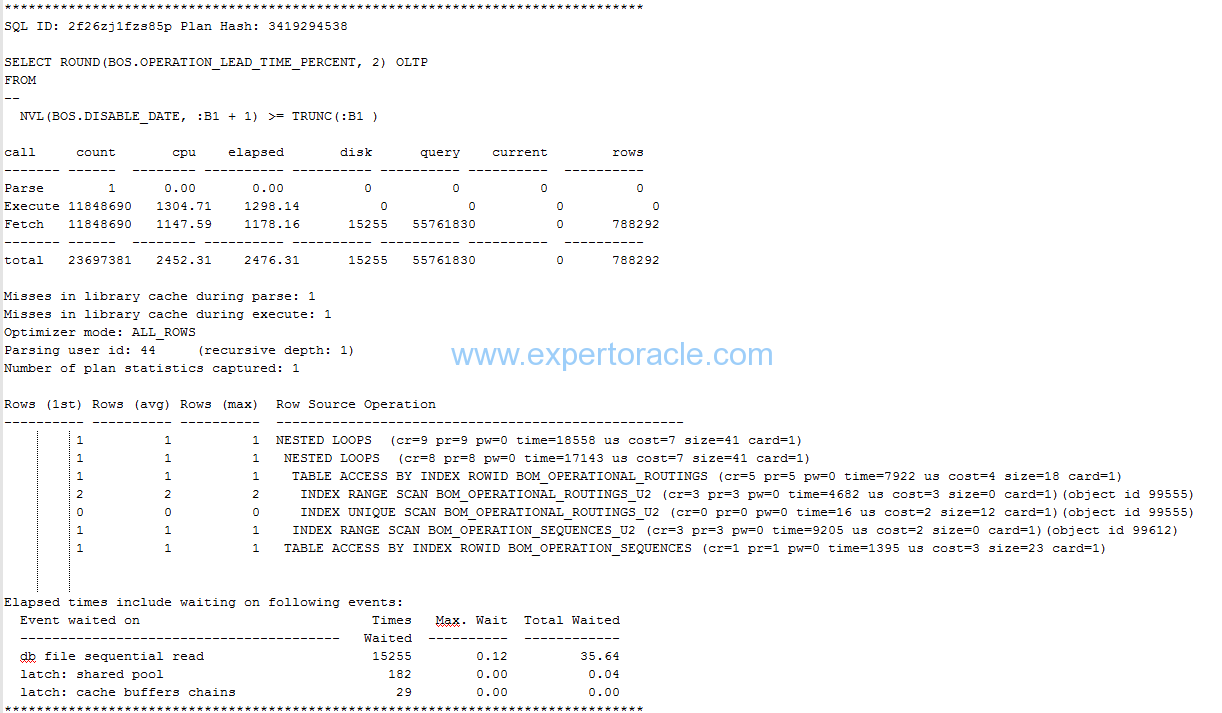
All other parameters significance we have already understood earlier in this post. There are few parameters that are showing up under last Wait event section and which are explained below.
| TERM | UNIT OF MEASURE | MEANING |
| Event Waited on | Not Applicable | The wait events for which the SQL statement waited |
| Times Waited | Number of times | Number of times a wait event has occurred. |
| Max. Wait | seconds | Maximum wait time in seconds for a single wait event. |
| Total Waited | seconds | Total wait time in seconds for a wait event. |
In ideal situation:
Elapsed Time – CPU Time = Total Waited time
but you may not find it always true. One possible reason can be that your trace was not level 8 so no wait event timing was recorded or may be your timed_statistics parameter it self is FALSE.
This is one of the post in Performance Tuning Fundamentals Series. Click on below links to read more posts from the series:
- Performance Tuning Basics 1 : Selectivity and Cardinality
- Performance Tuning Basics 2 : Parsing
- Performance Tuning Basics 3 : Parent and Child Cursors
- Performance Tuning Basics 4 : Bind Variables
- Performance Tuning Basics 5 : Trace and TKPROF – Part 1: Trace
- Performance Tuning Basics 6 : Trace and TKPROF – Part 2: Generating TKPROF
- Performance Tuning Basics 7 : Trace and TKPROF – Part 3: Analyzing TKPROF Files
- Performance Tuning Basics 8 : Trace File Analyzer (TRCA)
- Performance Tuning Basics 9 : Optimizer Mode
- Performance Tuning Basics 10 : Histograms
- Performance Tuning Basics 11 : Steps to analyze a performance problem
- Performance Tuning Basics 12 : Dynamic Performance Views
- Performance Tuning Basics 13 : Automatic Workload Repository (AWR) Basics
- Performance Tuning Basics 14 : Active Sessions History (ASH) Basics
- Performance Tuning Basics 15 : AWR Report Analysis
- Performance Tuning Basics 16 : Using SQL Tuning Health-Check Script (SQLHC)


- Oracle Multitenant DB 4 : Parameters/SGA/PGA management in CDB-PDB - July 18, 2020
- Details of running concurrent requests in Oracle EBS - May 26, 2020
- Oracle Multitenant DB 3 : Data Dictionary Architecture in CDB-PDB - March 20, 2020
Nice article – thanks for sharing.
Great one.