In last post we created oracle cloud database by following a very simple process on the Oracle Cloud Console. We verified the database by connecting to compute node that the database is running normal.
In this post we will access some Oracle Database GUI based tool which can be used to manage/monitor the cloud database easily.![]()
Below are the steps that we will follow in this post
STEP 1 : ACTIVATE EM EXPRESS SERVICES ON DATABASE
STEP 2 : OPEN REQUIRED PORTS TO ACCESS DATABASE APPLICATIONS
      OPTION 1: SET UP SSH TUNNEL FOR ACCESSING REQUIRED PORTS
      OPTION 2: OPEN PORTS USING NETWORK SECURITY RULES
STEP 3: ACCESS EM DATABASE 12C CONSOLE
STEP 4: ACCESS DBaaS MONITOR CONSOLE
STEP 5: ACCESS APPLICATION EXPRESS CONSOLE
STEP 1 : ACTIVATE EM EXPRESS SERVICES ON DATABASE
We will activate the Enterprise Manager Express Database Console on both our container database named “BRIJESH” (port 5502) and PDB1 pluggable database (port 5503). For the container database “BRIJESH” activate also port 5500 for HTTPS access.
[oracle@brijesh admin]$ sqlplus / as sysdba
SQL*Plus: Release 12.2.0.1.0 Production on Sat Dec 31 01:26:14 2016
Copyright (c) 1982, 2016, Oracle. All rights reserved.

Connected to:
Oracle Database 12c Enterprise Edition Release 12.2.0.1.0 - 64bit Production

SQL> EXEC DBMS_XDB.SETHTTPPORT(5502);
PL/SQL procedure successfully completed.

SQL> exec DBMS_XDB_CONFIG.SETHTTPSPORT(5500);
PL/SQL procedure successfully completed.

SQL> alter session set container=PDB1;
Session altered.

SQL> EXEC DBMS_XDB.SETHTTPPORT(5503);
PL/SQL procedure successfully completed.
STEP 2 : OPEN REQUIRED PORTS TO ACCESS DATABASE APPLICATIONS
For security, the Oracle Database Cloud Service is locked down. Only the SSH protocol and its port are enabled, and that still requires the use of public/private key for you to connect. To access the Database Cloud Service by your application you will need to enable additional ports. You can do this by using the Compute Cloud Service console and creating or re-using protocol definitions and Security Access Rules. Another method is to use an SSH tunnel.
We will be exploring both methods in this post. You can choose any of the option below or try one, complete testing, come back to this step and try another option too.
STEP 2 – OPTION 1: SET UP SSH TUNNEL FOR ACCESSING REQUIRED PORTS
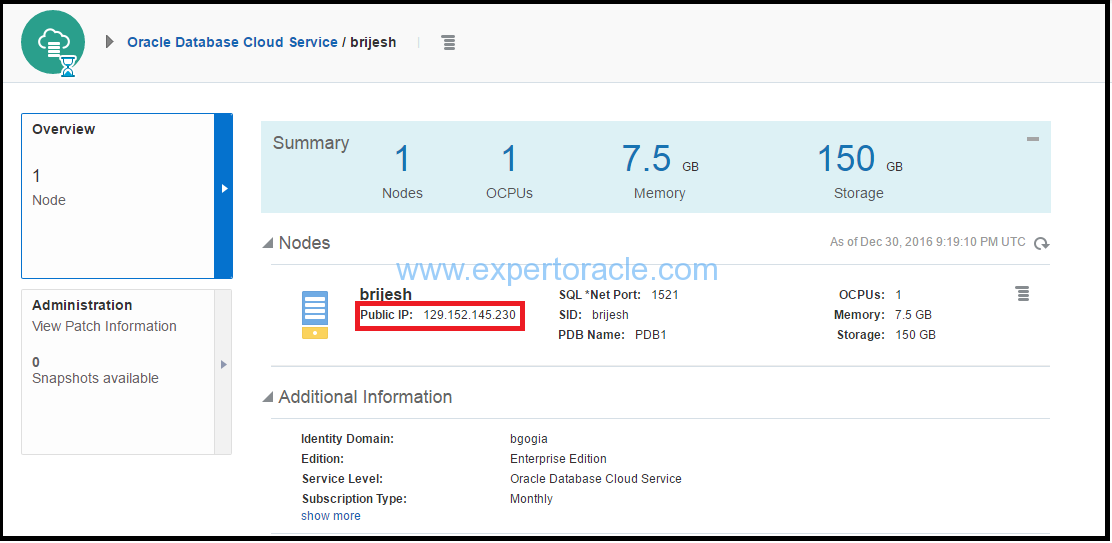
A. Record the IP address of the Database Cloud Service.
Click on your database instance from the list of Database Services and note down the public IP Address.
B. Run Putty and create tunneling
Below step is based on the assumption that client is windows machine (like our windows 8.1 laptop).
In this step you will run Putty and set up the SSH Tunnel and Port Forwarding. By doing this we will be accessing the management tools using the SSH connection which is authenticated and encrypted, and connecting to the remote server (Cloud) as though we were connecting to your local machine.
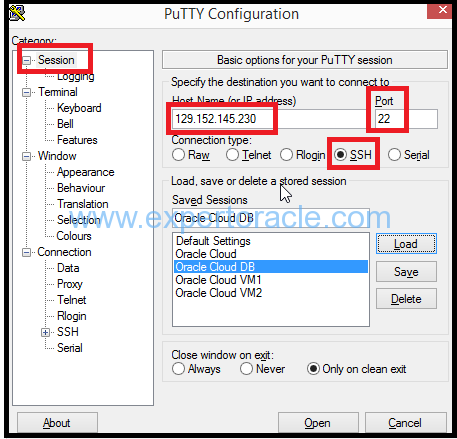
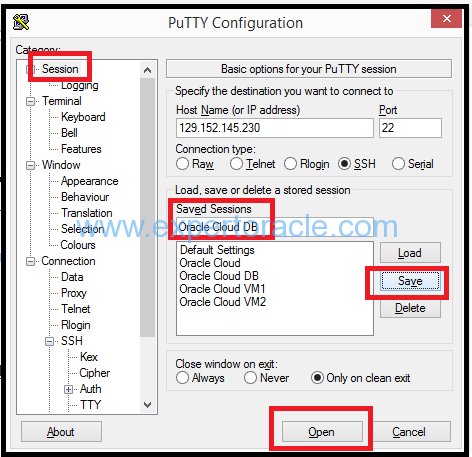
Run Putty. In the Session Category, enter the IP address of your cloud database host. Select SSH for Connection Type. Enter Port 22
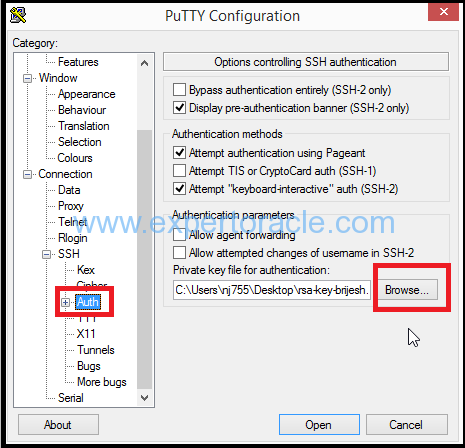
From the Connection category, expand SSH and select Auth, and browse for your private key that you created with PuttyGen.
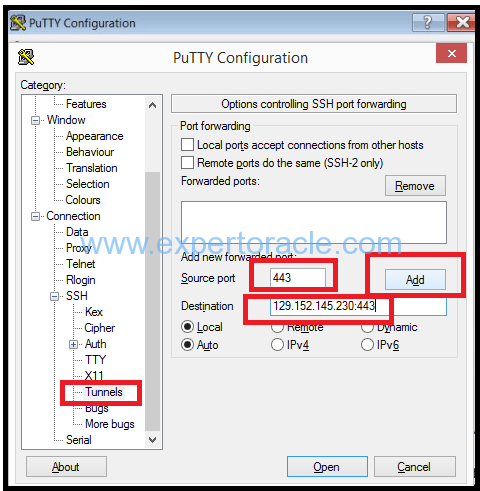
Now select Tunnels and add all the below ports one by one
// Database Cloud Service Monitor and APEX

New Forwarded Port = 443
Destination = 129.152.145.230:443
Click Add

// Database SQL Net Access

New Forwarded Port = 1521
Destination = 129.152.145.230:1521
Click Add

// Enterprise Manager Express

New Forwarded Port = 5500
Destination = 129.152.145.230:5500
Click Add

// Enterprise Manager Express CDB

New Forwarded Port = 5502
Destination = 129.152.145.230:5502
Click Add

// Enterprise Manager Express PDB1

New Forwarded Port = 5503
Destination = 129.152.145.230:5503
Click Add
Add all ports like below:
To save the settings, go back to Session Category. Type a name for your Saved Session and click Save.
You have now created a configuration for an SSH Tunnel with Local Port Forwarding to the Cloud. Click Open to open the connection to your database.
Note that you need to keep your terminal window open to keep the SSH Tunnel session alive so that youa are able to access the management consoles through this tunnel.
STEP 2 – OPTION 2: OPEN PORTS USING NETWORK SECURITY RULES
To gain access to the consoles used by the Database Cloud Service you can also open up the port on which the console is listening without creating the SSH tunnel.
In this step you will open the port 5500 for Enterprise Manager Express using a pre-created Security Rule and Security Application from the Compute Cloud Service.
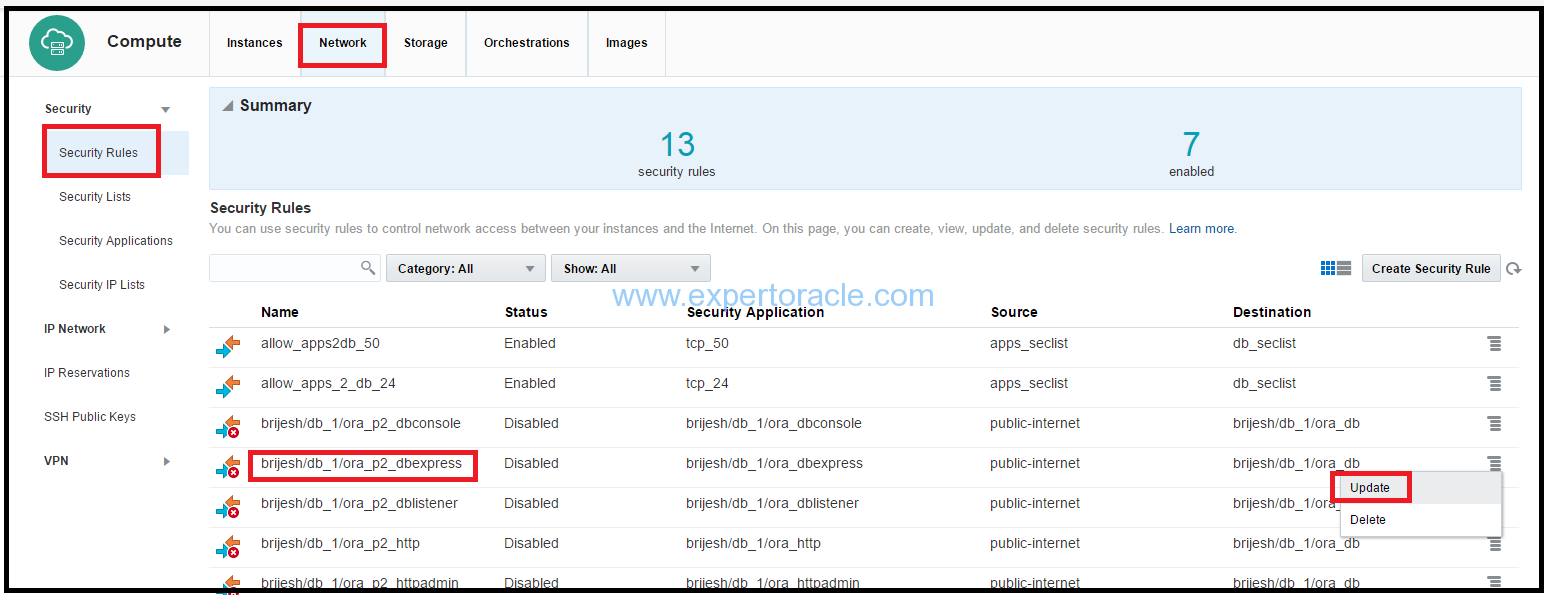
Go to the Compute Cloud Service dashboard. Click on Network > Security Rules.
Search for dbexpress security rule and click on the action menu on right side and the click ‘update’
Change Status to Enabled and click Update
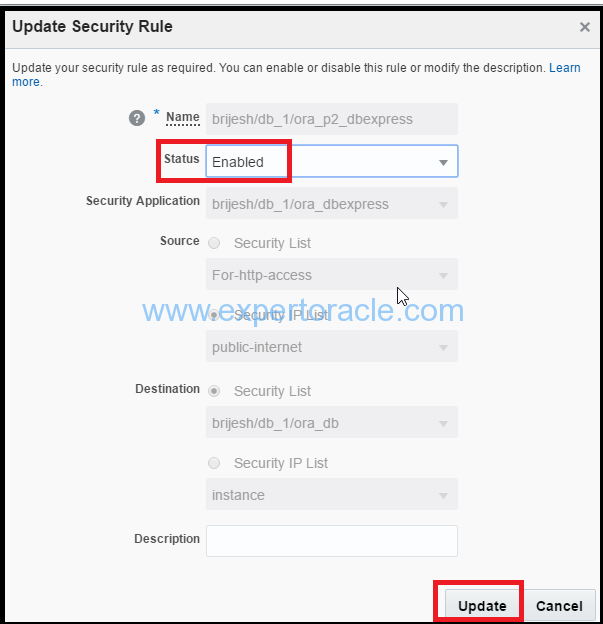
Enabling this security rule will open required port and you will be able to access the em console at below link.
https://129.152.145.230:5500/em/login
Similar to allowing “EM console” we have security rules for allowing the “Apex Console” and “dbaas_monitor console”. You can enable those security rules and can access all three of these consoles which we are discussing in next step.
STEP 3: ACCESS EM DATABASE 12C CONSOLE
Open a web browser window on your machine, and navigate to
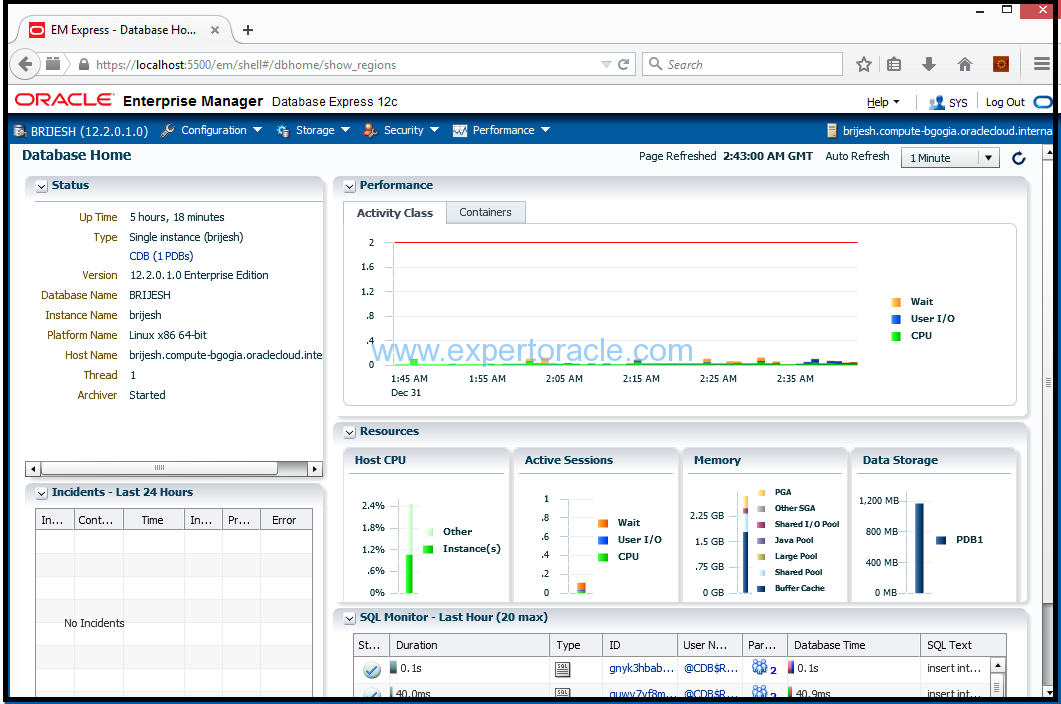
http://localhost:5502/em for the Container Database
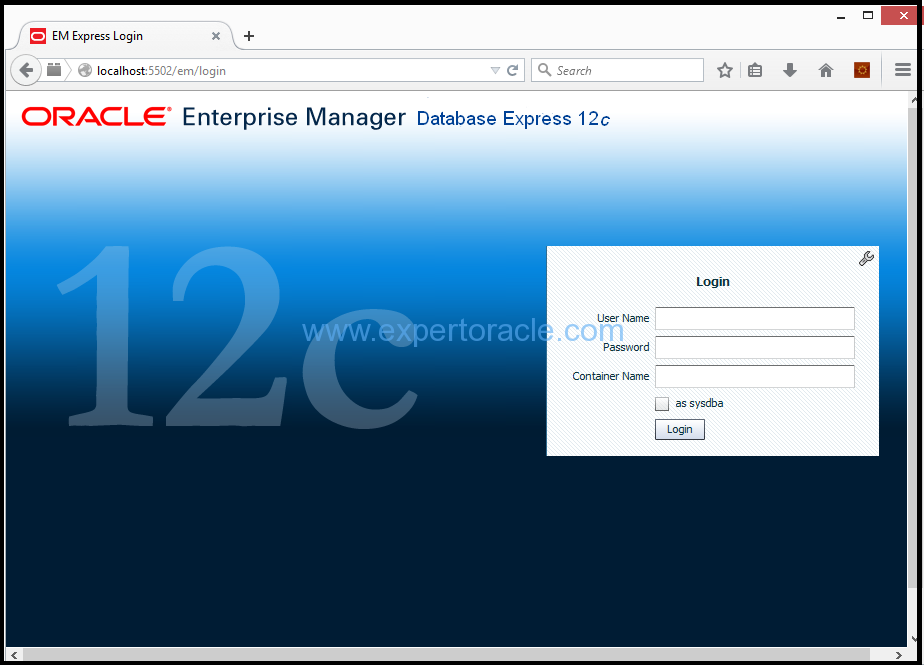
Login with sys credentials as sysdba
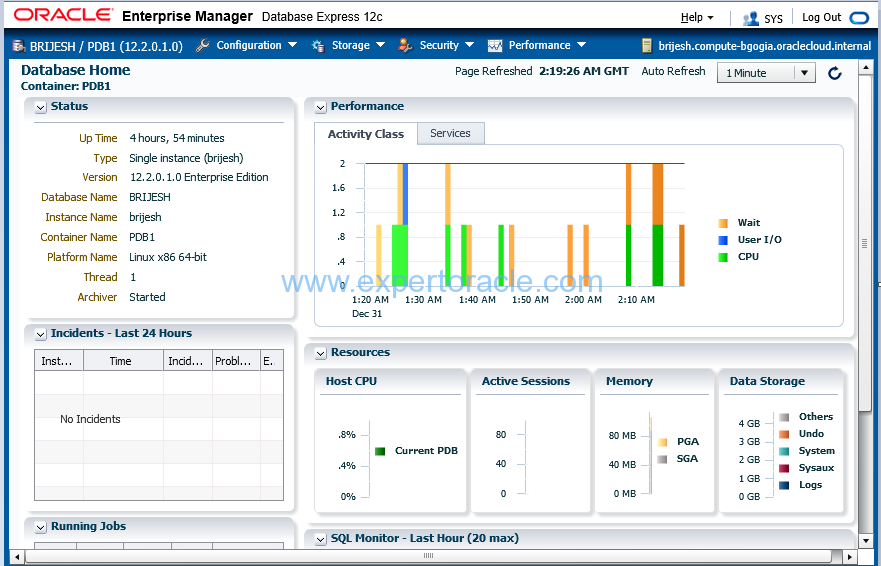
You can monitor Pluggable database PDB1 from http://localhost:5503/em
Enter the following URL to access the DBaaS Enterprise Manager Console for our container database:
https://localhost:5500/em
STEP 4: ACCESS DBaaS MONITOR CONSOLE
Now access the DBaaS Monitor page using using
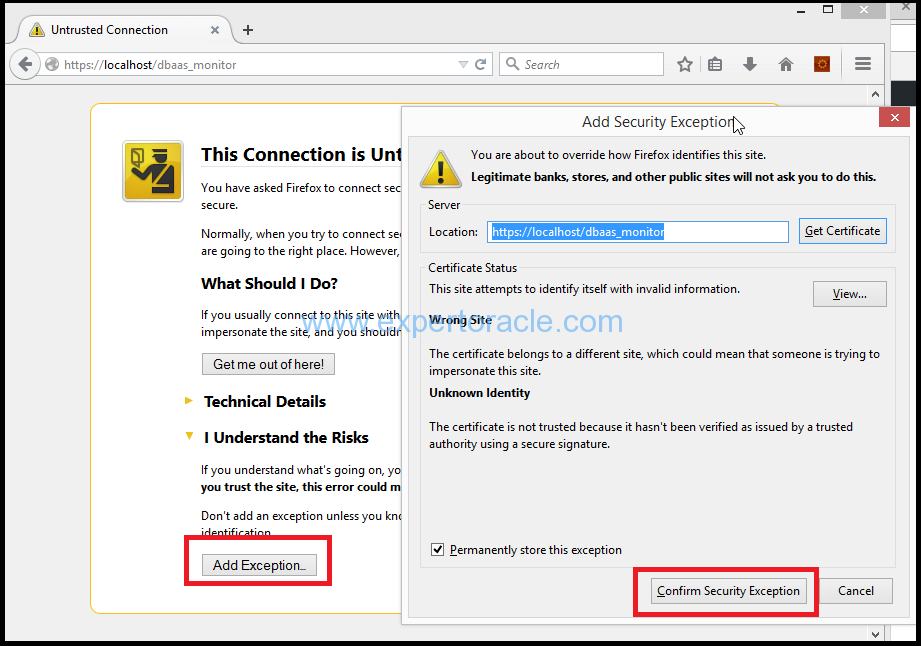
https://localhost:8083/dbaas_monitor
You may receive a warning the This Connection is Untrusted. If you receive this warning, expand the I Understand the Risks section and click on the Add Exception button. You will be prompted with an Add Security Exception dialog. Click on the Confirm Security Exception button:
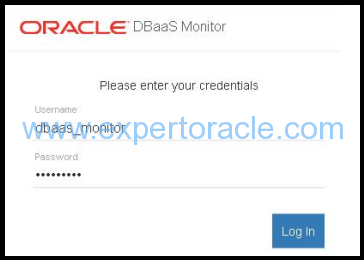
When prompted, enter dbaas_monitor for the User Name, and for the Password enter the system password that you kept at the time of database creation.
Once connected to the Database Monitor Console, you will be able to see the console and its metrics.
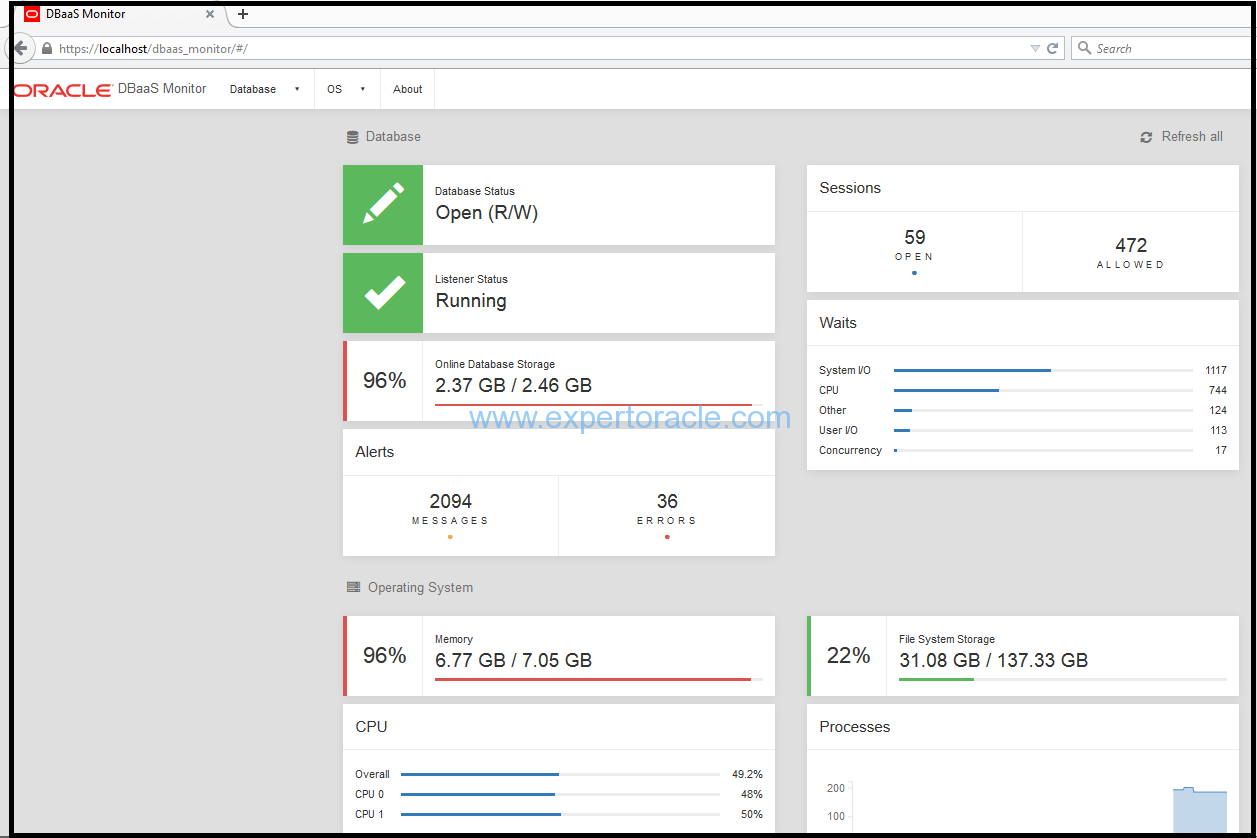
DBaaS monitor console as you can see is very simple looking GUI tool and non-technical staff will probably love it because of easy readability and ability to produce technical details/data in graphical forms. This tool will very neatly show you what is the database/storage/processes/memory status, backup status, tablespace disk space status, current sessions, current waits, OS level memory/storage/process/CPU
This tool also give you access to stop/start container/pluggable database, stop/start listener, modify the dynamic init parameters.
We don’t see this tool has any email sending functionality for alerts etc like OEM 12c/13c has.
STEP 5: ACCESS APPLICATION EXPRESS CONSOLE
Enter the following URL into a browser window to access the Apex console
https://localhost/apex/pdb1/
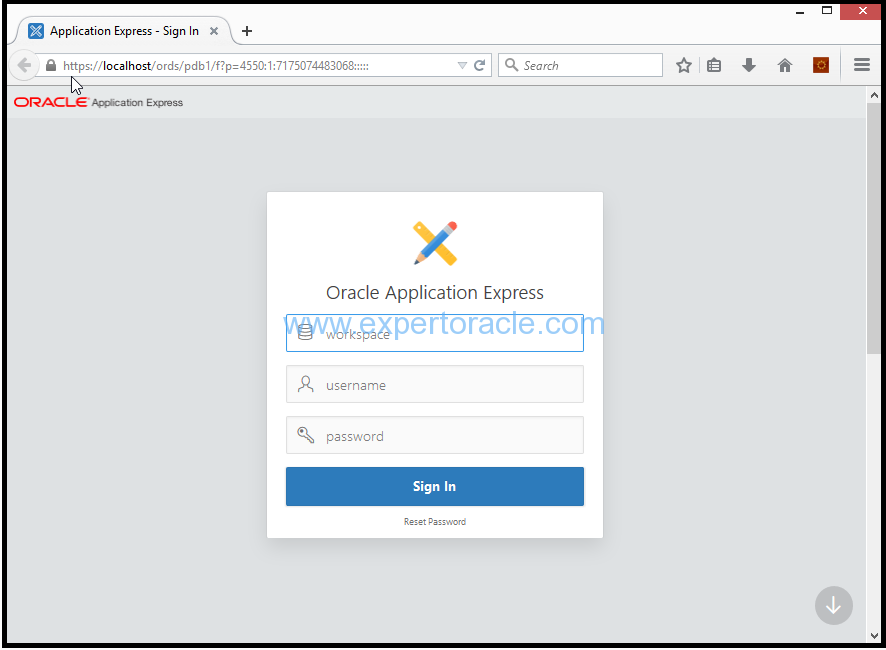
Once the Apex login window is displayed, enter the following and click on Sign
Workspace: internal
Username: ADMIN
Password: enter password that was setup at the time of database creation
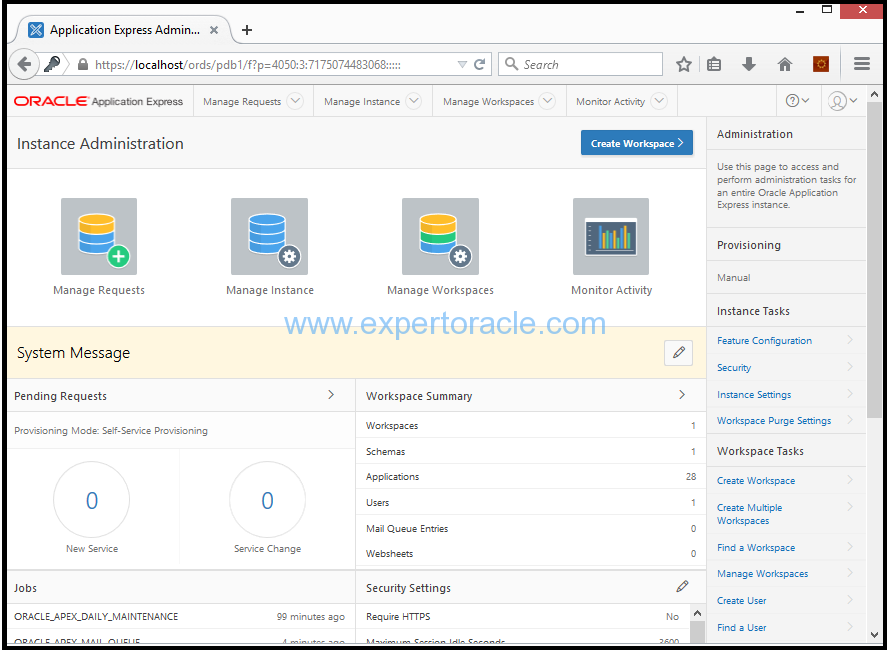
You are now connected to Apex. This ‘Apex’ as you can see is enhanced version of old Apex and it is now here used to configure and manage the DBaaS tools that the Oracle Cloud provides.
All three tools that we discussed above helps administrator in managing/monitoring the database on cloud with ease. EM console and Apex were available earlier too with the Oracle database and most DBAs are already familiar with these tools. OEM 12c or 13c is great tool to achieve what all these tools do.


- Oracle Multitenant DB 4 : Parameters/SGA/PGA management in CDB-PDB - July 18, 2021
- Oracle Multitenant DB 3 : Data Dictionary Architecture in CDB-PDB - March 20, 2021
- Oracle Multitenant DB 2 : Benefits of the Multitenant Architecture - March 19, 2021