You can utilize Oracle Database dynamic performance views to query important tuning related parameters like memory utilization, Disk I/O, Disk structure etc. These dynamic performance views are special views that are continuously updated while a database is open and in use.
Note that the actual dynamic performance views are identified by the prefix V_$. Public synonyms for these views have the prefix V$. You should access only the V$ objects, not the V_$ objects.
V$ vs GV$ views

=> For almost every V$ view there is a corresponding GV$ (global V$) view in case of RAC database.
=> In RAC database, querying a GV$ view retrieves the V$ view information from all qualified instances.
=> Each GV$ view contains an extra column named INST_ID of datatype NUMBER.
=> The INST_ID column in GV$ views has the instance number from which the associated V$ view information was obtained.
KEY DYNAMIC PERFORMANCE VIEWS
Below are some of the key dynamic performance view that we we use frequently when troubleshooting any performance issue.
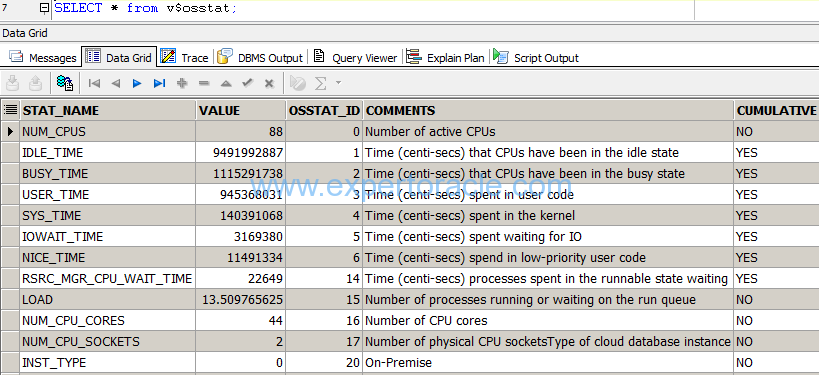
V$OSSTAT
- Useful view when you don’t have access to database server but want to see the OS level parameter values
- “Comments” column in the table explains the parameter.
- Columns where “Cumulative” column is “YES”, have the cumulative value since the database instance startup.
- Columns where “Cumulative” column is “NO”, means the value is constant/current.
SELECT stat_name, value, comments from v$osstat;
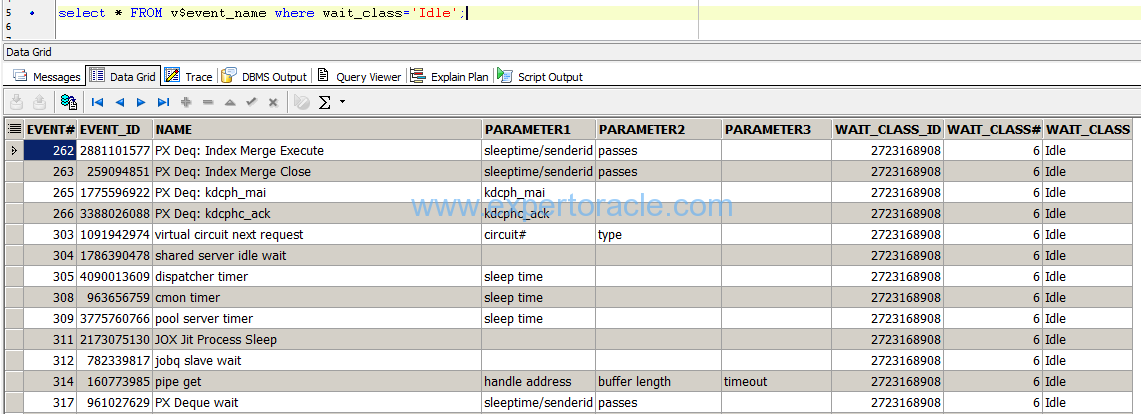
V$EVENT_NAME
- Oracle has many wait events((1200+) and those wait events are classified into 13 wait classes.
- You may need to find out which wait event falls under which wait class. Example if you are getting “pipe get” even you may need to see if this is “idle” wait event.
Example below we are trying to find which all wait events fall under “idle” category.
select * FROM v$event_name where wait_class='Idle';
V$SESSION
V$SESSION has a lot of columns and describing all will not be possible here. We are mentioning only few column names which we refer frequently. Refer to the Oracle Database Reference manual for additional information
- V$SESSION is one key dynamic view which you will be using very frequently.
- V$SESSION stores the current database session as well as what the session is doing
- STATUS column will tell you if session is active/inactive/killed etc
- TYPE column will tell you if the session is for the BACKGROUND process or USER process.
- LOGON_TIME will tell you when the session was initialized.
- USERNAME will tell you which database user has made connection with database
- SCHEMANAME will tell you which database schema the session is connected to
- OSUSER will tell you which OS user executed it
- SQL_ID column will tell you the current SQL getting executed by session
- LAST_CALL_ET will tell you how much time the session is in current status
- PREV_SQL_D will tell you the SQL_ID of the SQL which was getting executed previous to the current SQL_ID
- STATE column will show you if statement is currently waiting.
V$PROCESS
- This view contains information about the currently active processes.
- SPID – Operating system process identifier
- USERNAME – Operating system process username.
- BACKGROUND – 1 for a background process; NULL for a normal process
- PGA_USED_MEM – PGA memory currently used by the process
- PGA_MAX_MEM – Maximum PGA memory ever allocated by the process
V$SQL and V$SQLAREA
- Information about cursors associated to SQL statements is available at the parent level is stored in V$SQLAREA
- Information about cursors associated to SQL statements is available at the child level is stored in V$SQL.
- SQL_ID column can be searched to find the SQL information
- SQL_TEXT column provides the first 1,000 characters
- SQL_FULLTEXT provide the complete SQL statement text.
- PROGRAM_ID – If Pl/SQL was executed then the ID of the pl/sql program is shown
- PROGRAM_LINE# – If Pl/SQL was executed then the line# where SQL is located.
- LOADS – Number of time the hard parses happened
- FIRST_LOAD_TIME – First time when hard parse happened
- LAST_LOAD_TIME – Last time when hard parse happened
- SQL_PROFILE- Name of the SQL profile used when generating the execution plan.
- SQL_PLAN_BASELINE – Name of the SQL Baseline used during generation of execution plan
- PLAN_HASH_VALUE – hash value of the execution plan linked to SQL
- ROWS_PROCESSED- how many rows the SQL processed
- ELAPSED_TIME- amount of DB time used for processing
This is one of the post in Performance Tuning Fundamentals Series. Click on below links to read more posts from the series:
- Performance Tuning Basics 1 : Selectivity and Cardinality
- Performance Tuning Basics 2 : Parsing
- Performance Tuning Basics 3 : Parent and Child Cursors
- Performance Tuning Basics 4 : Bind Variables
- Performance Tuning Basics 5 : Trace and TKPROF – Part 1: Trace
- Performance Tuning Basics 6 : Trace and TKPROF – Part 2: Generating TKPROF
- Performance Tuning Basics 7 : Trace and TKPROF – Part 3: Analyzing TKPROF Files
- Performance Tuning Basics 8 : Trace File Analyzer (TRCA)
- Performance Tuning Basics 9 : Optimizer Mode
- Performance Tuning Basics 10 : Histograms
- Performance Tuning Basics 11 : Steps to analyze a performance problem
- Performance Tuning Basics 12 : Dynamic Performance Views
- Performance Tuning Basics 13 : Automatic Workload Repository (AWR) Basics
- Performance Tuning Basics 14 : Active Sessions History (ASH) Basics
- Performance Tuning Basics 15 : AWR Report Analysis
- Performance Tuning Basics 16 : Using SQL Tuning Health-Check Script (SQLHC)


- Oracle Multitenant DB 4 : Parameters/SGA/PGA management in CDB-PDB - July 18, 2021
- Oracle Multitenant DB 3 : Data Dictionary Architecture in CDB-PDB - March 20, 2021
- Oracle Multitenant DB 2 : Benefits of the Multitenant Architecture - March 19, 2021