Histogram helps Oracle Optimizer in generating a better execution plan specially when the data is highly skewed in the table. You can say a histogram is an optional special type of column statistic data that provides more detailed information about the actual data distribution in a table column.
Before going into Oracle Histograms details, let us understand what it Histogram in simple language.
HISTOGRAM IN SIMPLE NON-TECHNICAL WORDS
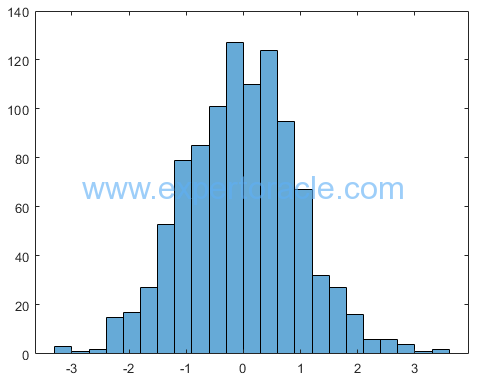
A histogram is an accurate representation of the distribution of numerical data. It is a kind of bar graph. To construct a histogram, you divide the entire range of values into a series of intervals—and then count how many values fall into each interval. The intervals must be adjacent, and are often of equal size. A rectangle is erected over the ‘interval” with height proportional to the frequency — the number of cases in each interval. A histogram when drawn will look something like below.
Histograms are one of the mostly commonly used statistical tools for studying data distributions. Statistician use histograms to visualize the shape of the data set and determine if there are gaps or clusters in the data set. Histograms give a rough sense of the density of the underlying distribution of the data and this information can be useful to SQL query
HOW ORACLE USES HISTOGRAMS
Histograms tell the Optimizer about the distribution of data within a column. Without a histogram, the Optimizer assumes a uniform distribution of
rows across the distinct values in a column.
Example:
Assume there is a table named ENGINE having 10,000 records and it has Column names SALE_COUNTRY. This column stores information about how many engines are sold per country. Assume that engines are sold only to three countries: India, US and UK.
Assume that 9000 engines were sold to India, 900 to US and 100 to UK.
Table: ENGINE
Column Name: SALE_COUNTRY
You ran a SQL query to find out how much engines were sold to UK.
WITHOUT HISTOGRAM
Optimizer will calculates the cardinality (number of rows returned) by dividing the total number of rows in the table by the number of distinct values in the column.
Cardinality= Total_records/number_of_distinct _values= 10000/3= 3333
As the data distribution in SALE_COUNTRY column is not uniform so cardinality estimate is showing up as 3333 while for UK we have only 100 records. Keeping such high cardinality in mind, Oracle may try to use the full scan here and query cost will be high.
WITH HISTOGRAM
The presence of a histogram changes the formula used by the Optimizer to estimate the cardinality, and allows it to generate a more accurate execution plan. So mostly in above case Oracle will look at the histogram and choose a low-cost index range scan (if available).
TYPES OF HISTOGRAMS
Oracle uses two types of histograms mainly for column statistics: height-balanced histograms and frequency histograms.
1. Height – balanced Histograms : A height-based histogram is used when there are more distinct values than the number of buckets. In this type, the column values are divided into bands so that each band contains approximately the same number of rows. In this histogram type values will be evenly spread through the buckets.
2. Frequency Histograms : This type of Histograms are more precise and are more widely used by Oracle. Each value of the column corresponds to a single bucket of the histogram. This is also called value based histogram. Each bucket contains the number of occurrences of that single value only. Frequency histograms are automatically created when the number of distinct values is less than or equal to the number of histogram buckets specified.
Oracle 12c also introduced hybrid histogram which combines characteristics of both height-based histograms and frequency histograms and also Top-frequency histograms which are a variant on the frequency histogram, where the histogram only focuses on the popular values, ignoring the less popular values as statistically insignificant.
HOW TO VERIFY IF YOUR TABLE IS USING HISTOGRAM
You can query DBA_TAB_COL_STATISTICS or USER_TAB_COL_STATISTICS view to get this information easily. Example below:

KEY DATABASE PARAMETERS RELATED TO HISTOGRAMS
METHOD_OPT
This is the parameter which tells Oracle Engine to create histogram while collecting the statistics.
The default value of METHOD_OPT from 10g onwards is ‘FOR ALL COLUMNS SIZE AUTO’.
Below are possible values for the METHOD
AUTO: Oracle determines the columns to collect histograms based on data distribution and the workload of the columns.
REPEAT: Collects histograms only on the columns that already have histograms.
SKEWONLY : Oracle determines the columns to collect histograms based on the data distribution of the columns.
INTEGER VALUE: Number of histogram buckets. Any value between 1 -254. Note that setting 1 will disable the Histogram collection
This basically implies that Oracle will automatically create histograms on those columns which have skewed data distribution and there are SQL statements referencing those columns.
TO VERIFY YOUR CURRENT SETTING
SQL> select dbms_stats.get_prefs ('METHOD_OPT') from dual;

DBMS_STATS.GET_PREFS('METHOD_OPT')
--------------------------------------------------------------------------------
FOR ALL COLUMNS SIZE AUTO
TO CHANGE YOUR SETTING TO “REPEAT”
SQL> exec dbms_stats.set_global_prefs ('METHOD_OPT','FOR ALL COLUMNS SIZE REPEAT');
TO DISABLE THE HISTOGRAM COLLECTION
SQL> exec dbms_stats.set_global_prefs ('METHOD_OPT','FOR ALL COLUMNS SIZE 1');
HOW TO CREATE / DELETE HISTOGRAMS
If DBMS_STATS gathers statistics is used for a table, and if the queries have referenced the columns in this table, then Oracle Database creates histograms automatically as needed. Oracle engine updates the data dictionary table SYS.COL_USAGE$ regularly based on user queries running in the database.
You can simply let Oracle collect all the histograms it wants and then drop any of histograms that cause you performance problem and then set the preference to tell the optimizer not to gather it again.
The following command drops the histogram on the EMP_ID column:
BEGIN
 dbms_stats.Delete_column_stats(ownname => 'SCOTT', tabname => 'EMP',
 colname => 'EMP_ID', col_stat_type => 'HISTOGRAM');
END;
/
The following command prevents the Optimizer from creating a histogram further on the EMP_ID column in the EMP table:
BEGIN
dbms_stats.Set_table_prefs('SCOTT', 'EMP',
'METHOD_OPT'=>'FOR ALL COLUMNS SIZE AUTO, FOR COLUMNS SIZE 1 EMP_ID');
END;
/
WHEN TO CREATE HISTOGRAMS
Create Histograms in below situation:
1) Create for the column which are included in the WHERE clause
2) AND also when the column is highly skewed.
Note that Histograms are not just for indexed column but also for the non-indexed columns
Do not create Histograms in below situation:
1) Data in column is evenly distributed.
2) Column is not used in a where clause.
3) Do not create on every column of the table as it will increase the stats collection time, parsing time and also can cause optimize to generate bad plans.
4) Do not create Histograms on primary key.
5) Do not create histogram when the column is unique and is used only with equality predicates
TIPS FOR HISTOGRAMS
- Frequency histograms are more precise, than Height Balanced histograms.
- Histograms are stored in the dictionary and maintenance and space cost is there. So create histograms only when required.
- Histograms are not gathered on columns for which there is no predicate information in the col_usage$ table.
- col_usage$ is only populated when columns referenced in predicates and hard parsing occurred.
This is one of the post in Performance Tuning Fundamentals Series. Click on below links to read more posts from the series:
- Performance Tuning Basics 1 : Selectivity and Cardinality
- Performance Tuning Basics 2 : Parsing
- Performance Tuning Basics 3 : Parent and Child Cursors
- Performance Tuning Basics 4 : Bind Variables
- Performance Tuning Basics 5 : Trace and TKPROF – Part 1: Trace
- Performance Tuning Basics 6 : Trace and TKPROF – Part 2: Generating TKPROF
- Performance Tuning Basics 7 : Trace and TKPROF – Part 3: Analyzing TKPROF Files
- Performance Tuning Basics 8 : Trace File Analyzer (TRCA)
- Performance Tuning Basics 9 : Optimizer Mode
- Performance Tuning Basics 10 : Histograms
- Performance Tuning Basics 11 : Steps to analyze a performance problem
- Performance Tuning Basics 12 : Dynamic Performance Views
- Performance Tuning Basics 13 : Automatic Workload Repository (AWR) Basics
- Performance Tuning Basics 14 : Active Sessions History (ASH) Basics
- Performance Tuning Basics 15 : AWR Report Analysis
- Performance Tuning Basics 16 : Using SQL Tuning Health-Check Script (SQLHC)


- Oracle Multitenant DB 4 : Parameters/SGA/PGA management in CDB-PDB - July 18, 2021
- Oracle Multitenant DB 3 : Data Dictionary Architecture in CDB-PDB - March 20, 2021
- Oracle Multitenant DB 2 : Benefits of the Multitenant Architecture - March 19, 2021
Thanks A lot Sir . One of the most valuable content I found on internet . Thanks
Thanks a lot Sir . One of the most valuable content I found on Internet .. Thanks .